


In early November last year, industry group the American Council of Life Insurers (ACLI) published its annual Life Insurers Fact Book, the organisation’s deep dive into a range of sub-categories of the US life insurance industry. In December, we looked at 2023’s developments in surrenders, new business and solvency; this month, as was the case last year, we’re taking a look at the US life insurance market as a whole: Its health; size and outlook.
Ownership Trends
Last year, we observed that around 14% of US life Insurers were foreign owned. This has been a slowly developing trend over the last two decades, but over that time the geographical composition of overseas owners had changed markedly, with mainland European owners diminishing in numbers and being replaced by parent companies domiciled in tax havens, notably Bermuda. In 2023, that largely remained the picture, with overseas ownership remaining at 14% and the only notable change being a tiny reduction in the Bermudan component (24 falling to 22) with the Cayman ownership rising by one from nine to 10.
As we observed last month, the most notable change in the insurance company landscape is not just the ownership make-up but that the number of companies are continuing to shrink. It’s slow, but seemingly inexorable.
Table 1: Number of US Life Insurers, 2001 – 2023 
Source: ACLI Life Insurer’s Fact Book, 2024 Edition
Clearly, the number of firms has fallen and there are some seemingly logical reasons why this may have been so, namely increasing levels of regulation and the reducing viability for small firms to continue without a merger.
For non-stock companies specifically, limited or expensive access to capital ought to be a reason for demutualisation but in fact, the figures don’t really bear this out. There has been a slightly ahead-of-trend reduction in the number of mutuals, but the change is not vastly different to the reduction in stock companies. The conclusion one would draw is that the decline in numbers of firms is primarily down to rationalisation and cost reduction across the board rather than an increasing need for new capital.
Business Composition
Last month, I observed that whilst there was an overall growth in individual life insurance policy liabilities of 1.6%, we didn’t highlight that, for all life insurance business including group business, the overall change was also similar, at 1.7%.
This contrasts with the growth of overall company liabilities of 5.7%, suggesting that another part of the business book, namely annuities, is growing much faster. The health insurance business book is a steadily growing product line but is still much smaller than the other two.
The faster growth of all liabilities does not in itself indicate that the size of the annuity book is growing faster than the life insurance book, but the relative proportions of new business between the two business streams is certainly one factor. The relative increase in reserves could simply be down to the use of a lower discount rate which can increase the value of one type of liabilities more than the other.
Certainly, annuity liabilities with longer outstanding durations can be very sensitive to yields on long bonds but bond yields did not drop between the start and end of 2023. Due to the low granularity of the ACLI data it is hard to work out whether all of this reserve growth is down to yield changes, but instinctively it is probably not, and that the extra growth in reserves is almost certainly due to a faster rate of net new annuity business compared to life insurance.
Figure 1: Composition of US Life Insurance (by value of liabilities), 2002 – 2023 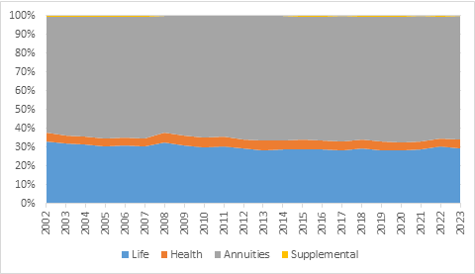
Source: ACLI Life Insurer’s Fact Book, 2024 Edition
The update of this chart above, which we published last year, shows a slight broadening of the annuity component, but it is fairly hard to detect by eye. Annuity business is continuing to dominate the life insurance market, but life insurance is certainly not going away.
The almost insignificant supplemental business is primarily add-ons, such as waiver of premium cover and other sickness benefits.
US Life Insurance Market Size (by Liabilities)
An update of the chart below offers greater clarity. From 2021 to 2022, policy liabilities fell, largely as a result of a rise in bond yields increasing valuation discount rates. The step up in 2023 from 2022 in total liabilities looks very similar to that observed from 2020 to 2021, although this change arose from additional business rather than a change in the valuation discount rate as discussed above.
Figure 2: US Life Insurer Liabilities, 2002 – 2023 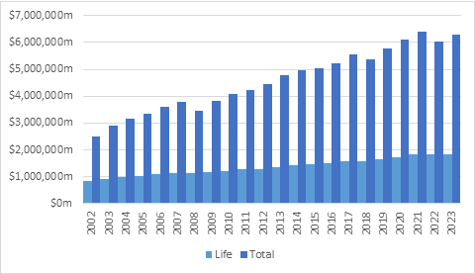
Source: ACLI Life Insurer’s Fact Book, 2024 Edition
Growth in reserves for the life insurance component alone has plateaued. Part of the reason is the technical effect described above, whereby higher discount rates suppressed reserve growth in 2022, but they have not grown notably in 2023 either. This, despite having used a similar reserving discount rate in both of 2022 and 2023, is confirmed by the modest growth rate of 1.7% in reserves.
Is this a sign that fewer people are buying life insurance, or are becoming under-insured? Are household finances becoming sufficiently stretched that people are prepared to run uninsured risks for their family that they would otherwise not have done before? Would people have used life insurance products primarily as savings vehicles, which just conveniently came with integrated life cover, and have now lost the savings habit?
Possibly, but it is more likely to be a mere interregnum driven by temporary (one would hope) financial pressures. Group life policies have grown a little faster than individual policies and, as they tend to be for the lower income end of the market, low paid workers may be allowing group policies to provide them with some protection, even if they should really be topping this up with some additional cover of their own. These are all plausible reasons for the slow down.
A structural change to the marketplace, on the other hand, is more difficult to determine. It is possible that strong population migration is adding to the low-paid workforce, but not necessarily to the higher paid; but in time, this may rebalance and as newcomers move up the income scales, so should their need for more cover. Other than the financial stress of the inflationary period, and some short-term demographic changes, there are no clear structural reasons why demand for life cover should not follow the trajectory of the economy in general.
Figure 3 below shows the continuing strong correlation between US life insurance cover and US GDP growth.
Figure 3: US Life Insurer Liabilities (rebased 2002) vs US GDP Growth, 2002 – 2023 
Source: ACLI Life Insurer’s Fact Book, 2024 Edition
The dark blue line represents all policy liabilities and whilst it is tracking GDP closely, it is clear there has been a divergence in recent years, before a re-convergence in 2023. The orange line represents the growth in life insurance policies alone and here there has been considerably more correlation with US GDP, with any signs of detachment only coming at the point of the onset of Covid-19.
This should not be a surprise; a heavy application of quantitative easing in 2020 and 2021 (to tide over costs from the pandemic) would have potentially inflated liabilities in those years by depressing interest and therefore valuation discount rates, but since 2021 there has been some flatlining as we have discussed previously.
The divergence in between the dark blue line and US GDP is clearly the stead effect of rising levels of annuity business. The US experienced a slightly less marked and less enduring bulge in the rate of births after the Second World War than, say, the UK or Germany, but there was still a significant baby boom effect, both after a loss of many lives and also from the rapid rise in post war earnings.
This ‘boomer bulge’ is now reappearing en masse; not as births, but as retirements, driving the growth in the annuity market. This also combines with a significant switch from defined benefit (DB) to defined contribution (DC) funding mechanisms; in the US, the Pension Protection Act (PPA) of 2006 brought this about by making deficit funding by companies more difficult whereas in the UK, for example, a tax change, increasing the tax on equity dividends, was the driver of the sounding of the death knell. Equally, in both jurisdictions, falling bond yields and rising life expectancies were also making DB pensions more expensive to finance., so inevitably, almost in parallel, DB schemes closed and are now providing a boom in pension risk transfer activity.
At some point in the medium term, this surge in annuity business will likely slow down again, but the effect of this huge bulge in policy liabilities will continue to persist on insurers balance sheets for much longer than that.
There was a highly unusual change in the composition of annuity business with individual new net contributions up 46.3% balanced with a reduction in group contributions of –36.6% but the overall change from 2022 to 2023 was just 2.9%. This may have been part of the risk transfer effect, but it is far too large a change in a single year for this to be the only explanation and other commentators have suggested that people were trading their level annuities from company schemes for index-linked annuities arranged individually. It certainly makes sense after a year in which inflation at 9% or so will have severely eroded the purchasing power of a level annuity.
Last year, I observed that the continued tracking of the US economy by the country’s life insurance market was a reassuring sign. Whilst there has been a slowdown in life policy sales in the past two to three years relative to the size of the economy, that benchmark is not a perfect one; the economy-boosting borrowing and spending policies of the Biden administration have been confined to very specific sectors, such as green energy projects which on the one hand boosts GDP, but on the other has likely not trickled down to the wider masses (who might deploy some of these extra riches into new insurance policies).
Solvency
The health of life insurers is of vital importance to secondary investors as well as giving confidence to individuals wanting to buy new policies for protection and needing their insurer to be there when the fateful moment arrives.
Here, the ACLI Fact Books provide a historic record of aggregate solvency levels for the industry. Solvency can be measured in numerous ways, with different measures of ‘surplus’ capital and different benchmarks to compare against. The simplest are insurers’ capital ratios, with the Asset Valuation Reserve (AVR) – which smooths against temporarily depressed market values of assets -either included or excluded. These ratios are insurers’ own capital and surplus and are divided by their general account reserves.
Figure 4 below shows a picture of continuing financial heath and even a modest improvement from 2022 to 2023.
Figure 4: US Life Insurer Broad Capital Ratios, 1970 – 2023 
Source: ACLI Life Insurer’s Fact Book, 2024 Edition
Perhaps a more meaningful ratio is one which might tell you if insurers are on the verge of triggering some sort of regulatory intervention, such as a cessation of new business or a full wind-down. Regulators prescribe a mechanism for determining what they consider the minimum capital for an insurer to be able to operate safely and breaching this is usually that trigger, so measuring the actual available capital against that regulatory minimum (the Risk Based Capital Ratio or RBC Ratio), gives the stakeholder a view on how likely a breach may occur. This comparison has the added advantage in that regulatory capital calculations will flex with economic conditions so at times of asset stress or buoyancy the capital requirement will flex with the assets – to an extent.
Figure 5: US Life Insurer RBC Ratios, 2002 – 2023 
Source: ACLI Life Insurer’s Fact Book, 2024 Edition
Both charts show a degree of ebb and flow over the years, but both also show a slight improvement in 2023.
The shortcoming of using averages is that they hide spread. However, the ACLI Fact Book does provide a distribution of insurers’ RBC ratios.
Figure 6: Percentage of US Life Insurers Whose RBC Ratio Exceeds 200%, 2013 – 2023 
Source: ACLI Life Insurer’s Fact Book, 2024 Edition
The number of companies below 200% is 32 and, as can be seen by the much smaller percentage below 200% measured by assets, these are generally the much smaller institutions. Of that 32, there are five falling below 100%. This does not make them insolvent, but financially fragile, however they are likely to be special companies with unusual characteristics and are unlikely to be of significant concern to secondary investors.
As was the case last year, the overall message here is one of consistency. US life insurer ownership and business composition trends remains at similar levels to recent years, albeit with small, but observable, trends. And solvency metrics appear to be solid. All in all, as counterparties for longevity and mortality risk investors, US life insurers remain strong.
Roger Lawrence is Managing Director at WL Consulting
Any views expressed in this article are those of the author(s) and may not necessarily represent those of Life Risk News or its publisher, the European Life Settlement Association


