


In early November last year, industry group the American Council of Life Insurers (ACLI) published its annual Life Insurers Fact Book, the organisation’s deep dive into a range of sub-categories of the US life insurance industry. In December, we looked at 2023’s developments in surrenders, new business and solvency and in January, we took in the US life insurance market as a whole (its health; size and outlook). This third and final article looks at policy sales, which should be of interest to a range of asset managers, including life settlements, life ILS, asset intensive life reinsurers, and more.
This most recent ACLI report refers to the year 2024 which, at the time of writing, is already just over a year old. And the information is of a low granularity, so one needs to be aware that there are some generalisations being used to imply trends. The types of policy most commonly traded in the life settlement secondary market, for example, are only a subset of the whole range of life insurance products issued, so a trend in total business may not perfectly reflect the trend in tradeable products alone.
Policy Cancellations
Policy exits come about as death or maturity claims and, possibly most commonly, through lapse (with no value) or surrender (if there is an intrinsic value) although the two may be aggregated in some statistics. The ACLI provides cancellation rates split by surrender and lapse and then split the figures between individual and group policies; we will focus on the former.
The numerical values in Figures 1 and 2 below from 2024 (2023 in parentheses) are: by face value, lapses 4.7% (4.3%), surrenders 1.1% (1.0%); by numbers of policies, lapses 6.6% (7.3%), surrenders 1.3% (1.2%).
Figure 1: Individual Policy Cancellations by Face Amount
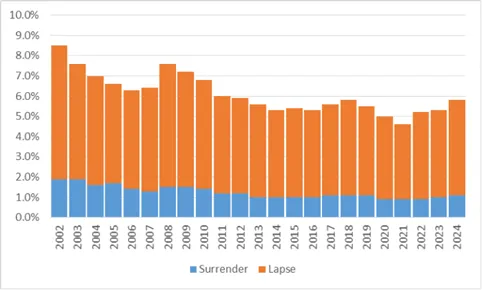
Source: ACLI Life Insurer’s Fact Book, 2025 Edition
Figure 2: Individual Policy Cancellations by Number
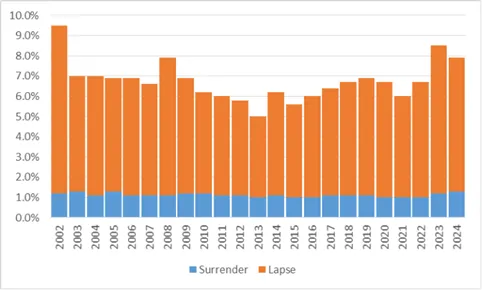
Source: ACLI Life Insurer’s Fact Book, 2025 Edition
These two charts tell a story in itself. Clearly, 2023 saw an uptick in cancellations compared to 2022 and 2021 but the increment was fairly small when measured by aggregate face amount, yet significant when measured by policy numbers. The implication is that much of the cancellation activity was on policies with smaller than average face amount; when measured by number, it is notable that the proportionate increase in the orange lapse bars is much greater than the increase in surrenders for value.
The figures for 2024 are, perhaps, more surprising. Measured by face amount, both lapses and surrenders were up compared to 2023, and notably so, as the total step-up was greater year-on-year than from 2022 to 2023. Measured by number of policies, we see a more unusual result; overall cancellations were down, but the reduction was entirely due to a drop in lapses because the number of surrenders was up. Although fewer lapses occurred, those that did take place were larger policies. Surrenders, on the other hand, seemed to occur in roughly the same proportion by face and number, suggesting little change in average face being surrendered.
Total surrender values paid out on individual policies rose 23.7% in the year from $35.8bn to $44.2bn. Compared to a surrender rate rising from 1.2% to 1.3% or +8% (or up to 17% if the maximum rounding differential were assumed), it shows a large rise in per policy surrender value.
In absolute terms, the numbers of surrenders are large. Of the $14trn of face value of individual policies in force, $154bn was surrendered. Of the 134 million policies in force, 1.74 million were surrendered. The average surrender value, $24,400, was not huge, and the average face amount involved is also small at around $90,000. Although the secondary life settlement market is less interested in policies of this size and is focussed more on policyholders of a specific age profile, it nonetheless seems highly likely that there is plenty more potential origination available than currently reaches the life settlement market.
New Policy Sales and In Force
Policyholders wanting to dispose of unwanted policies are the lifeblood of today’s life settlement secondary market, but new business is the material being laid down to fuel the market in the future. Replacement is the minimum requirement for sustainability, but, in an ideal world, the business book would be expanding. In a scenario where all other things are equal, new business growth ought to be at least as fast as US population growth, and when you add in price inflation and economic growth, one would hope for some of that to drive up new business volumes though policyholders taking out new policies with larger amounts of cover.
When we compared the growth in in-force life policy reserves with general US GDP last month we saw that in the last two or three years, sales volumes have become slightly decoupled. When we look at the aggregate in-force book of policies over the last couple of decades, we do see a pattern of decline, but it has been relatively slow. In recent years, new business has stabilised at a new lower level since the millennium, but it is slightly disappointing that there is no obvious uptick.
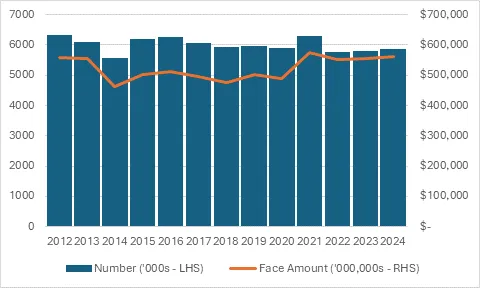
Figure 3: Individual Policies – Numbers (000s)
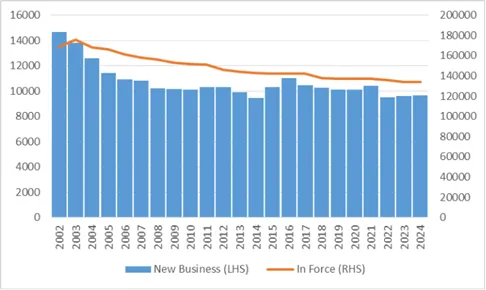
Source: ACLI Life Insurer’s Fact Book, 2025 Edition
In Figure 3, we see the in-force population holding steady at 134,000,000 (the orange line on the right hand scale). New sales hover just around the 10 million mark, with the new sales (blue bars, left hand scale) up on 2023 by just 60,000 policies (or 0.6%, which might be considered in line with population expansion).
On the alternative measure of aggregate face amount, the picture is more encouraging. New business is rising and so is the in-force total. Figure 4 below captures not just changes in population headcount, but the gradual uprating of the levels of cover needed per policyholder, partly through inflation, and partly from economic growth and prosperity.
Figure 4: Individual Polices – Face Amount (000,000s)
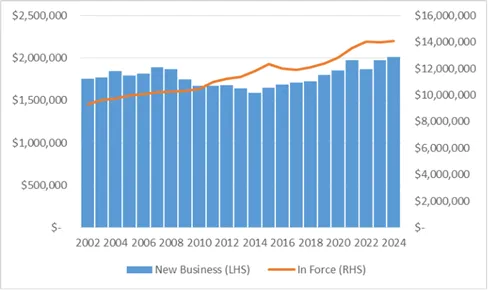
Source: ACLI Life Insurer’s Fact Book, 2025 Edition
The aggregate face amount of new business is increasing; new face just exceeded $2trn for the first time, a 2% increase year-on-year, and the total in-force also hit a new record at $14trn. The larger increase in new face amount compared to numbers looks healthy, but is not quite keeping pace with price inflation.
The average face amount of new business crept up to $208,000 (Figure 5 below) which represents an increase of 1.4%. Of the 2% total growth in new business, clearly, 1.4% is from an increase in policy size and the other 0.6% is from the growth in numbers of new policies issued. That rate of increase in policy size of 1.4% is lower than both CPI and Core inflation at 2.9% and 3.2%, respectively.
Figure 5: Average Face Amount for New Business
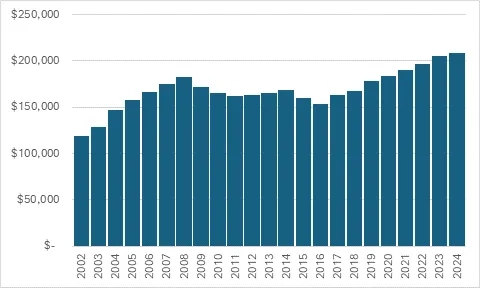
Source: ACLI Life Insurer’s Fact Book, 2025 Edition
Within the group “Individual Life Insurance” are a number of different products, notably Term Assurances (both level and decreasing) and Whole of Life policies. The former tend to be used for covering temporary risks, such as repaying an open home purchase loan should a wage earner die early and one would expect the average face amounts on these products to rise in line with or close to house prices. Whole of Life contracts are used partly as savings vehicles but also to cover liabilities on death and are more likely to rise with general rises in wages (or just price inflation).
Figure 6: Average Face of all new Individual Life Insurance Policies vs House Prices vs Consumer Prices
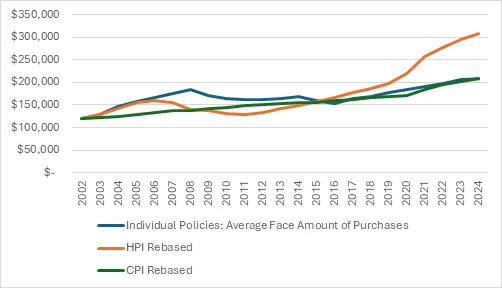
Source: ACLI Life Insurer’s Fact Book, 2025 Edition; FHFA, FRED
The blue line in Figure 6 is the average face amount from Figure 5. The orange line is the 2002 value for face amount indexed by the HPI index for all home purchases from the Federal Housing Finance Agency. Clearly, there is some correlation, with both experiencing a dip post-Global Financial Crisis, but as the blue line represents a composite of all insurance types, the correlation in recent years is not as strong. CPI, the grey line, shows no such dip and is continuously ascending throughout the study period.
Over the whole period, the correlation is greater with the CPI than with the HPI, but neither provides a perfect fit. If we could split out the two broad types of policy, however, each might correlate better to a particular index.
As for now, if we assume that term policies – which are roughly two-thirds of new business by face amount – are rising at a rate somewhere between HPI and CPI, then the conclusion one would draw is that the face amount on WOL and Endowment policies is not rising much at all and is probably falling in real terms.
Whole of Life and Endowments Specifically
Back to the future fuel for the life settlement market, which focusses on Whole of Life Policies, the ACLI data gives us some information here. WOL is aggregated with endowments, but those are a very small component and don’t detract from the conclusions we can draw.
Figure 7: Individual WOL and Endowment Policy New Business
Source: ACLI Life Insurer’s Fact Book, 2025 Edition
We are only able to show data back to 2012 for this specific subset of life policies but the picture mirrors life policies as a whole. The blue bars in Figure 7 are a subset of the blue bars in Figure 3 and the broad shape of the curve within the two is similar. The orange line in Figure 7 compares with the blue bars in Figure 4 and in this comparison of new face amount, there are differences. The spike in 2021 is pronounced in both, as is the subsequent fall in 2022, but on this measure using face values, 2023 and 2024 have not recovered to 2021 levels for WOL and endowments alone, whereas for all life policies, they have. This shows that whilst new WOL policy sales are stable, there is very little growth in face amount.
In conclusion, for the life settlement market, new policies that will fuel future trades continues to be issued in healthy volumes, but in real terms, are slowly contracting. On the one hand, other things being equal, this ensures the market should endure, but on the other, it suggests that growth will have to come not from naturally increasing policy size, but from the market needing to make further inroads in increasing the volumes of cancellations that reach it.
Roger Lawrence is Managing Director at W L Consulting
Any views expressed in this article are those of the author(s) and may not necessarily represent those of Longevity & Mortality Investor or its publisher, the European Life Settlement Association


